
Current State
Before I get into the story, here is the current result: Visual Studio Code debugging a C++ application with WinDbg under the hood through my first proof of concept integration.
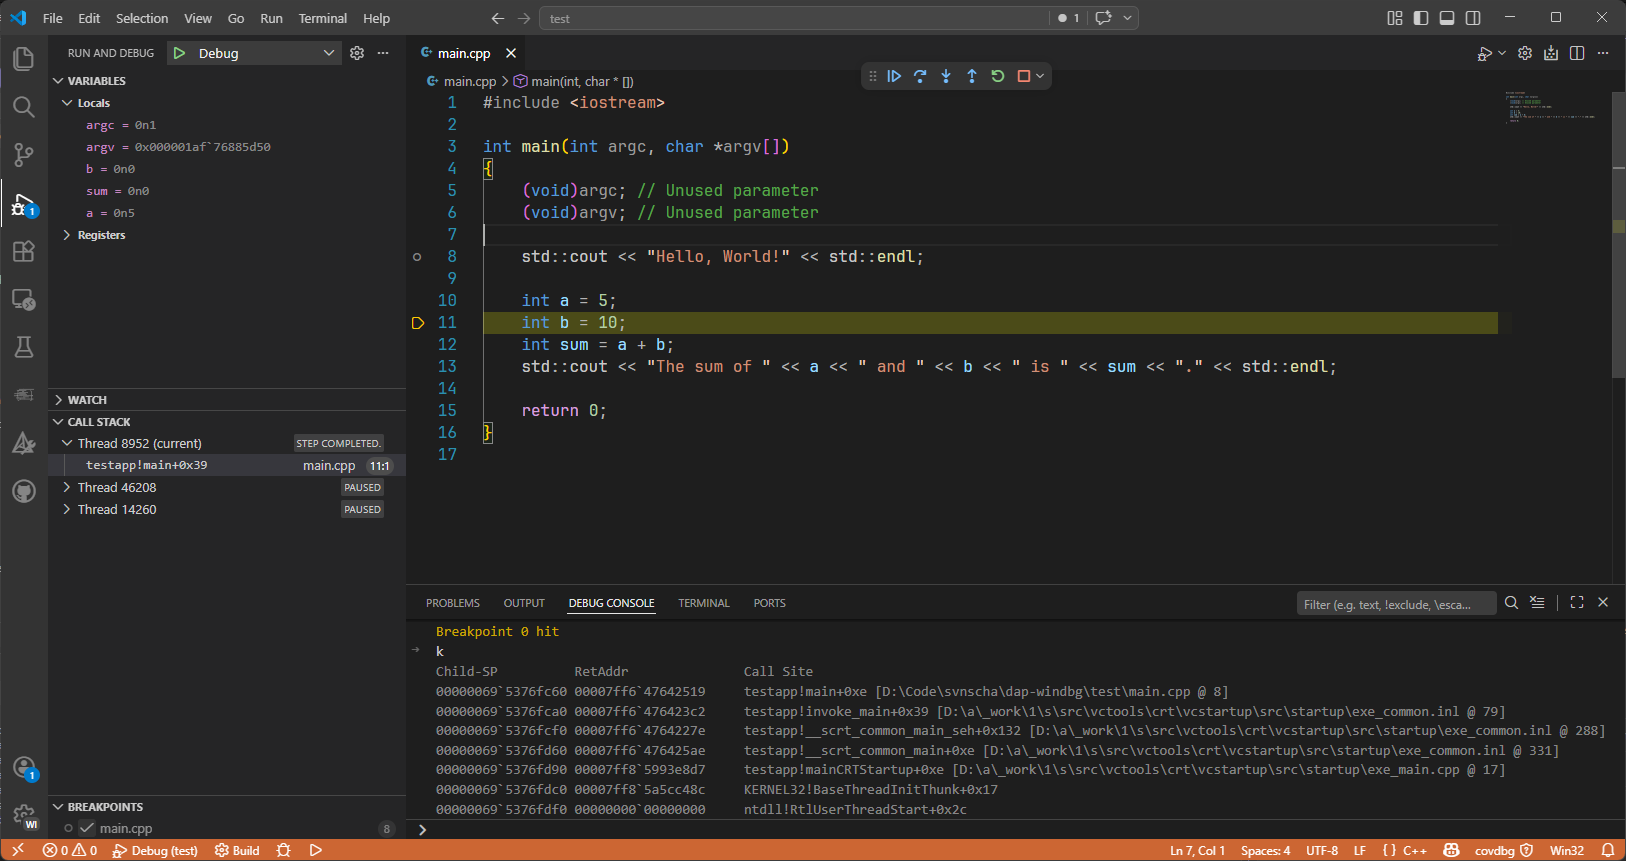
Right now this is still an early POC, not a finished debugger experience. It proves the architecture works and that VS Code can drive WinDbg through a custom adapter, but it still needs a lot more iteration before I would call it really useful.
One detail I already like is that the debugger command window is not a fake simplified console. I can type regular WinDbg commands straight into it.
Why
Because I do what I always do when a workflow annoys me: I build a tool until the annoyance goes away.
This time the pain point was remote debugging a service application running inside a VM. My ideal flow was simple:
- Compile locally
- Deploy to the VM
- Start or restart the service
- Attach a debugger
- Get back to work without ten minutes of clicking around
That sounded perfectly reasonable: a small helper extension for Visual Studio Code, a bit of automation, some launch configuration glue, and done.
That was the plan.
It did not stay the plan.
Removing Friction
I started with the pragmatic part first: automate the annoying steps.
I wired up a helper extension that could compile the service, copy the binaries to the VM, and prepare the remote machine for debugging. This is my favorite kind of productivity work, because the payoff is immediate. Every bit of friction you remove saves time again and again.
Once the plumbing was in place, I expected the final step to be easy: tell VS Code to remote debug the service and call it a day.
Instead, I hit a wall.
VS Code Is Not Visual Studio
At first glance, this feels like something that should already exist. Visual Studio has mature debugging capabilities. VS Code has debugging. Microsoft builds both. Surely there must be a supported path to do classic remote Windows debugging from VS Code, right?
Not really.
The more I dug into it, the clearer it became that the debugging stack in VS Code is a different world. VS Code speaks the Debug Adapter Protocol, or DAP. It expects debugger extensions to implement that protocol and sit between the editor and the actual debugger engine.
That part is good. DAP is a clean idea.
The frustrating bit was this: the specific native Windows remote-debugging flow I wanted was not available through a supported public route in VS Code. The Visual Studio native debugger stack is not something you can just plug into from your own VS Code extension and say, "Thanks, I will take remote debugging from here." And the VS Code side does not magically inherit Visual Studio's remote debugging capabilities just because both products come from Microsoft.
So after spending time exploring options, the conclusion was simple:
There was no supported way to get the workflow I wanted with the existing pieces.
Building It Anyway
Once I accepted that I would not be wiring together existing public APIs, the problem changed shape.
The question was no longer, "How do I enable remote debugging in VS Code?"
It became:
"What debugger engine can I control myself, and how do I make VS Code talk to it properly?"
That is where WinDbg entered the story.
WinDbg already knows how to do the important parts. User-mode debugging. Remote debugging. Kernel debugging. Crash dump analysis. It is a serious tool with decades of capability behind it.
But again, my tool of choice did not give me the VS Code experience I wanted out of the box.
So the next step was clear:
Build a debugger adapter for WinDbg.
Learning DAP
If you want to integrate a debugger with VS Code, DAP is the contract. Once I sat down and read it properly, a lot of things clicked.
The official home for it is the Debug Adapter Protocol website, and that site is worth bookmarking because it has both the overview and the actual specification. At the time I was working through this, the important mental model was simple: VS Code and the adapter exchange JSON messages with a very predictable shape, and the protocol defines what those messages are supposed to mean.
The protocol is straightforward. VS Code sends requests like initialize, launch, attach, setBreakpoints, stackTrace, variables, continue, next, and so on, and your adapter answers them while emitting events like initialized, stopped, continued, and terminated.
That sounds simple enough until you remember that a debugger is mostly state, timing, and edge cases.
Still, the protocol gave me exactly what I needed: a structured way to make VS Code think in terms of debugging, while I figured out how to translate that into WinDbg behavior.
This was the moment where the project stopped being a helper extension and became a real debugger adapter.
To make that a bit more concrete, a minimal launch payload for the current POC looks roughly like this:
The adapter currently points at the debugging engine directly, so the windbg setting names the WinDbg stack even though the configured path is dbgeng.dll rather than windbg.exe.
{
	"type": "dapwdbg",
	"request": "launch",
	"name": "Launch through WinDbg",
	"windbg": "C:/Program Files (x86)/Windows Kits/10/Debuggers/x64/dbgeng.dll",
	"program": "${workspaceFolder}/build/Debug/testapp.exe",
	"stopAtEntry": true
}
That stopAtEntry flag is a small but useful quality-of-life feature. I added it because it is a familiar debugger option and useful to have. By default it is false, so the adapter continues after configurationDone. If you set it to true, VS Code stays paused at entry and waits for the next command.
And on the wire, the messages are simple, which is exactly what you want from a protocol. A stop event coming back from the adapter looks roughly like this:
{
	"seq": 17,
	"type": "event",
	"event": "stopped",
	"body": {
		"reason": "entry",
		"description": "Paused at process entry.",
		"threadId": 1,
		"allThreadsStopped": true
	}
}
That might not look exciting, but it is the important part: once VS Code receives something in that shape at the right time, it knows how to show the stack, scopes, variables, and stepping UI around it.
Step 1: Parse the Schemas Instead of Hand-Writing Everything
One thing became obvious very quickly: I did not want to manually model the entire protocol by hand in C#.
That is the kind of task that feels fine for the first ten message types and becomes a waste of time by the next fifty.
DAP is defined by schemas. Machines should read schemas. Machines should generate code. Humans should not write all of that by hand.
So one of the first pieces I built was a small toolchain around the protocol definitions.
The idea was straightforward:
- Parse the protocol schemas
- Convert them into C# types
- Use generated models for requests, responses, events, and payloads
- Stop wasting time on repetitive plumbing
This bought me two things immediately:
- Better consistency with the protocol
- Faster iteration whenever I needed to expand coverage
It also reduced a whole category of annoying bugs where hand-written DTOs silently drift away from the spec.
That generator phase was not glamorous, but it kept paying off. Every time I added another request handler later, I was very happy not to be hand-authoring another stack of protocol classes.
The nice part is that the generated code stays very literal. For example, the generated LaunchRequest model is basically just a strongly typed wrapper around the DAP shape, with Command = "launch" baked in and a typed Arguments property. A generated event model like StoppedEvent then points at a generated StoppedEventBody class with fields such as Reason, Description, ThreadId, and AllThreadsStopped.
That is exactly the level of abstraction I wanted. The protocol layer should be boring and explicit so the interesting work can happen one layer above it.
Step 2: A Python Generator That Produces C#
Yes, the adapter is in C#.
Yes, I used Python to generate part of it.
That combination made sense for the job. Python is still one of the fastest ways to build a transformation tool, especially when the task is basically: read structured input, normalize it, and generate source code.
So I built a Python tool that parsed the protocol definitions and generated the corresponding C# code.
That generator handled the boring but important parts:
- Request and response classes
- Event payloads
- Shared protocol types
- Optional fields and enum-like shapes
- Enough structure to keep serialization predictable
This turned out to be one of the highest leverage steps in the whole project. Instead of spending my time on protocol plumbing, I could focus on the parts that actually matter: session management, command execution, state transitions, and debugger behavior.
In other words, I automated the boring part so I could focus on the interesting part.
Step 3: Wrap WinDbg Through dbgeng
Once the protocol layer was under control, the next question was how to talk to the debugger engine itself.
For that I went with dbgeng, the Windows debugging engine behind the debugger family. That is where the real power is. It is also where some of the complexity is.
On the package side, the current codebase still reflects some iteration. The wrapper layer currently leans on the public DbgEng interop exposed through the ClrMD packages Microsoft.Diagnostics.Runtime and Microsoft.Diagnostics.Runtime.Utilities. Separately, the broader adapter codebase also references Microsoft.Debugging.Platform.DbgEng and Microsoft.Debugging.Platform.DbgX, which are part of the newer Microsoft debugging platform stack. That split is real in the code today, but I do not want to pretend it is already the final architecture.
In the wrapper itself, the core interfaces in use right now are IDebugClient, IDebugControl, IDebugSymbols, and IDebugSystemObjects. For callbacks, I register IDebugEventCallbacks and IDebugOutputCallbacks. That gives me the essential surface area I need to launch or attach, execute commands, inspect symbols, enumerate threads, and react to breakpoints, exceptions, exits, and debugger output.
This wrapper layer became the core of the adapter. Its job was to expose the debugger in a way that fit the expectations of DAP rather than the expectations of a human typing commands into a debugger console.
That means translating concepts like:
- Launching or attaching to a target
- Resuming and breaking execution
- Enumerating threads
- Building stack traces
- Reading locals and variables
- Handling modules and symbols
- Surfacing exceptions, exits, and other stop reasons
If you have ever worked with debugger APIs, you know they do not hide much complexity. You need to be explicit. You need to think about ownership, state, timing, callbacks, and edge cases that often show up only once things are already going wrong.
One small example was line stepping. I had already enabled source line support and saw source locations show up, so for a moment I thought step over was working.
It did not.
What I had actually proven was that WinDbg could show me line information. That is not the same thing as telling it to do source-based stepping. I had forgotten to enable that part as well. The fix was one extra command:
public void EnableSourceLineSupport()
{
	ThrowIfDisposed();
	ExecuteDebuggerCommand(".lines -e", "Could not enable source line support");
	ExecuteDebuggerCommand("l+t", "Could not enable source-based stepping");
}
That was a very debugger-adapter kind of bug. Everything looked correct for just long enough to be misleading.
Step 4: Implement the Real Requests and Iterate
With the generated protocol types on one side and the WinDbg wrapper on the other, I could finally work on the adapter loop itself.
This is where it started to feel real.
I began with the core requests: initialize, launch, attach, setBreakpoints, configurationDone, threads, stackTrace, scopes, variables, continue, pause, next, stepIn, stepOut, disconnect, ...
On paper that looks like a clean checklist. In reality, each of those requests is a conversation between at least three parties:
- VS Code and its expectations
- The adapter and its internal state machine
- The debugger engine and its current state
So the implementation loop looked roughly like this:
- Add one request
- Run it in VS Code
- Watch it fail in an interesting way
- Fix the translation layer
- Hit the next state mismatch
- Repeat until the experience works the way it should
This is also where you learn that "technically works" and "feels right to use" are not the same thing.
It is not enough to answer the request. You have to answer it in the right order, at the right time, and with enough fidelity that the editor can build a coherent UI around it.
That was one of the more interesting parts of the project.
Here is a tiny slice of what that translation layer looks like today. After launch, the adapter records whether it should remain paused at entry or continue once VS Code finishes sending its setup messages:
_launchAwaitingConfigurationDone = true;
_launchStopAtEntry = DapArgumentReader.TryGetBoolean(arguments, "stopAtEntry")
	?? DapArgumentReader.TryGetBoolean(arguments, "stopOnEntry")
	?? false;
This is the kind of code that looks harmless until you realize it decides whether the whole session feels smooth or broken.
When It Worked
At some point the pieces clicked together.
I could launch a debugging session from VS Code, talk to WinDbg through the adapter, and use the editor as if this had always been a normal supported workflow.
It also stopped being just about the original VM service scenario. Because the adapter sits on top of WinDbg, it opened the door to more than the first use case:
- Local launch and local attach already work in the adapter
- Dump-file attach is wired in
- Remote attach and kernel scenarios are the next serious end-to-end targets
- Crash dump debugging is now a realistic extension of the same architecture
That was the point where the project started to feel solid.
Why This Was Fun
This was fun for the same reason good tooling work is always fun: it changes how you work.
You remove friction once, then benefit from it every day after that. And along the way, you learn where the real product boundaries are. Visual Studio and VS Code may look adjacent from the outside, but their debugging plumbing is very different. Once that became clear, the path forward became clear too.
What I Learned
This project taught me a few things very clearly:
- If a workflow matters enough, it is often worth productizing it for yourself
- DAP is a really good abstraction for debugger integration
- Code generation is the right answer when a protocol brings lots of repetitive structure
- Debugger adapters are mostly about state, timing, and translation
- WinDbg becomes much more approachable when you put a good UX in front of it
Also: if you think you fixed stepping, make sure you actually fixed it and did not just make the debugger show line numbers.
Most importantly, I was reminded again that some of the best side projects start as practical attempts to make tomorrow less annoying than today.
Wrapping Up
I only wanted a better remote debugging workflow for a service running in a VM.
That turned into DAP, schema parsing, code generation, dbgeng, and a long series of state-machine bugs.
The result so far is a working first proof of concept: a WinDbg-backed debugger adapter for Visual Studio Code with local launch, local attach, dump-file attach, stack traces, scopes, variables, breakpoints, and step commands working well enough to prove the architecture.
That matters because it means I finally have a base I can build on. I have not implemented remote debugging or kernel debugging yet, but I now feel ready to take a real shot at both without getting lost in the basics again.
What's Next?
The next step is to use this base for the work I actually set out to do:
- Harden the current adapter and clean up rough edges in the state machine
- Start implementing the actual remote debugging flow for the VM scenario
- Take a first real implementation shot at kernel debugging too
- Keep the scope under control so the project does not drift again like it did at the start
- Open source the project once the foundation is stable enough
- Keep turning WinDbg power into something that feels normal inside VS Code
And yes, this all started with "I just want to remote debug a service on a VM."
That is usually how the best tools start.