
uberAgent for Linux Has Arrived
After years of Windows getting all the monitoring love, uberAgent for Linux Technology Preview 1 has arrived - and it's everything we have been waiting for.
I run a multi-site setup with MikroTik Routers handling WireGuard tunnels from home to coworking space to my cloud infrastructure. Systems like sso-1, drive-1, and splunk-1 communicate over internal network, accessible through a gateway server, giving me that enterprise-grade distributed architecture. What gets me genuinely excited is finally having proper visibility into all that beautiful server workload. Docker hosts under load, reverse proxy performance, inter-service communication patterns, resource consumption across distributed services - this is where the real insights live.
Having uberAgent finally extend from Windows to my entire Linux infrastructure fills a gap I've been dealing with for years.
Why Linux Infrastructure Monitoring Just Got Interesting
You've got a beautiful Linux infrastructure running critical workloads, but your monitoring looks like Dr. Frankenstein's laboratory. A little Prometheus here, some custom scripts there, maybe some Grafana dashboards that kinda-sorta show you what's happening. You're stitching together metrics from five different tools just to answer simple questions like "Why is this service slow?" or "Which application is hammering my database?"
Meanwhile, your Windows colleagues are living it up with comprehensive uberAgent dashboards that actually make sense.
Not anymore.
Getting Started: Ubuntu Installation
Currently, uberAgent for Linux ships as .deb packages, making Ubuntu (and Debian-based) installations straightforward. Here's how to get it running on your systems.
Prerequisites
Please check the official documentation for the latest instructions.
So, before diving in, ensure your systems have the basics:
Manual Installation Process
First, extract the uberAgent package from the distribution ZIP:
# Create working directory
&&
# Extract the ZIP (assuming you've downloaded it)
# Find and install the .deb package
# Fix any dependency issues
Configuration Directory Structure
Once installed, uberAgent requires its configuration structure at /etc/uberAgent/. The key files you'll work with:
/etc/uberAgent/uberAgent.conf- Main configuration file/etc/uberAgent/- Additional configuration files/var/log/uberAgent/- Log files location
Basic Configuration Setup
Download the standard configuration bundle:
# Download the latest config bundle
# Extract to config directory
Splunk Integration
Edit /etc/uberAgent/uberAgent.conf to configure your Splunk HEC endpoint:
[Receiver]
Splunk
Splunk
HTTP
your-hec-token-here
Service Management
Start and enable the service:
# Check status
# View logs
Scaling with Ansible: Key Automation Snippets
For larger deployments, Ansible makes this process repeatable across your infrastructure. Here are the essential patterns I use:
Package Installation Task
- name: Install uberAgent from ZIP
  block:
    - name: Transfer and extract ZIP
      copy:
        src: "{{ uberagent_local_zip }}"
        dest: "/tmp/uberagent.zip"

    - name: Unarchive ZIP on target
      unarchive:
        src: "/tmp/uberagent.zip"
        dest: "/tmp/uberagent"
        remote_src: yes

    - name: Find .deb package
      find:
        paths: "/tmp/uberagent"
        patterns: "*uberagent*amd64*.deb"
        recurse: yes
      register: deb_search

    - name: Install via dpkg
      command: dpkg -i {{ (deb_search.files | map(attribute='path') | list)[0] }}
      register: dpkg_install
      changed_when: dpkg_install.rc == 0
      failed_when: dpkg_install.rc not in [0,1]

    - name: Fix dependencies if needed
      apt:
        state: present
        update_cache: yes
        name: "*"
      when: dpkg_install.rc == 1
Configuration Deployment
- name: Deploy uberAgent configuration
block:
- name: Download config bundle
get_url:
url: "{{ uberagent_config_bundle_url }}"
dest: "/tmp/uberAgent.uAConfig"
mode: "0644"
- name: Extract configuration bundle
unarchive:
src: "/tmp/uberAgent.uAConfig"
dest: "/etc/uberAgent/"
remote_src: yes
extra_opts:
Splunk Receiver Configuration
- name: Configure Splunk receiver
  block:
    - name: Define Splunk receiver block
      set_fact:
        uberagent_receiver_block: |-
          [Receiver]
          Name = {{ uberagent_receiver_name }}
          Type = Splunk
          Protocol = HTTP
          Servers = {{ uberagent_splunk_hec_url }}
          RESTToken = {{ uberagent_splunk_hec_token }}

    - name: Replace existing receiver configuration
      replace:
        path: "/etc/uberAgent/uberAgent.conf"
        regexp: '(?ms)^\[Receiver\]\nName *=.*?\nType *=.*?\nProtocol *=.*?\nServers *=.*?\nRESTToken *=.*?\n'
        replace: "{{ uberagent_receiver_block | regex_replace('\\n', '\n') }}\n"
      register: receiver_replace
      notify: restart uberAgent

    - name: Add receiver block if none existed
      blockinfile:
        path: "/etc/uberAgent/uberAgent.conf"
        marker: ";; {mark} ANSIBLE MANAGED RECEIVER BLOCK"
        block: "{{ uberagent_receiver_block }}"
        insertafter: EOF
      when: not receiver_replace.changed
      notify: restart uberAgent
These Ansible snippets give you the foundation - adapt the variables and structure to match your environment and deployment needs.
Performance Impact Analysis
Let's start with the most important question: what does uberAgent actually cost your infrastructure? This analysis shows uberAgent's resource consumption across multiple hosts over a full week of monitoring.
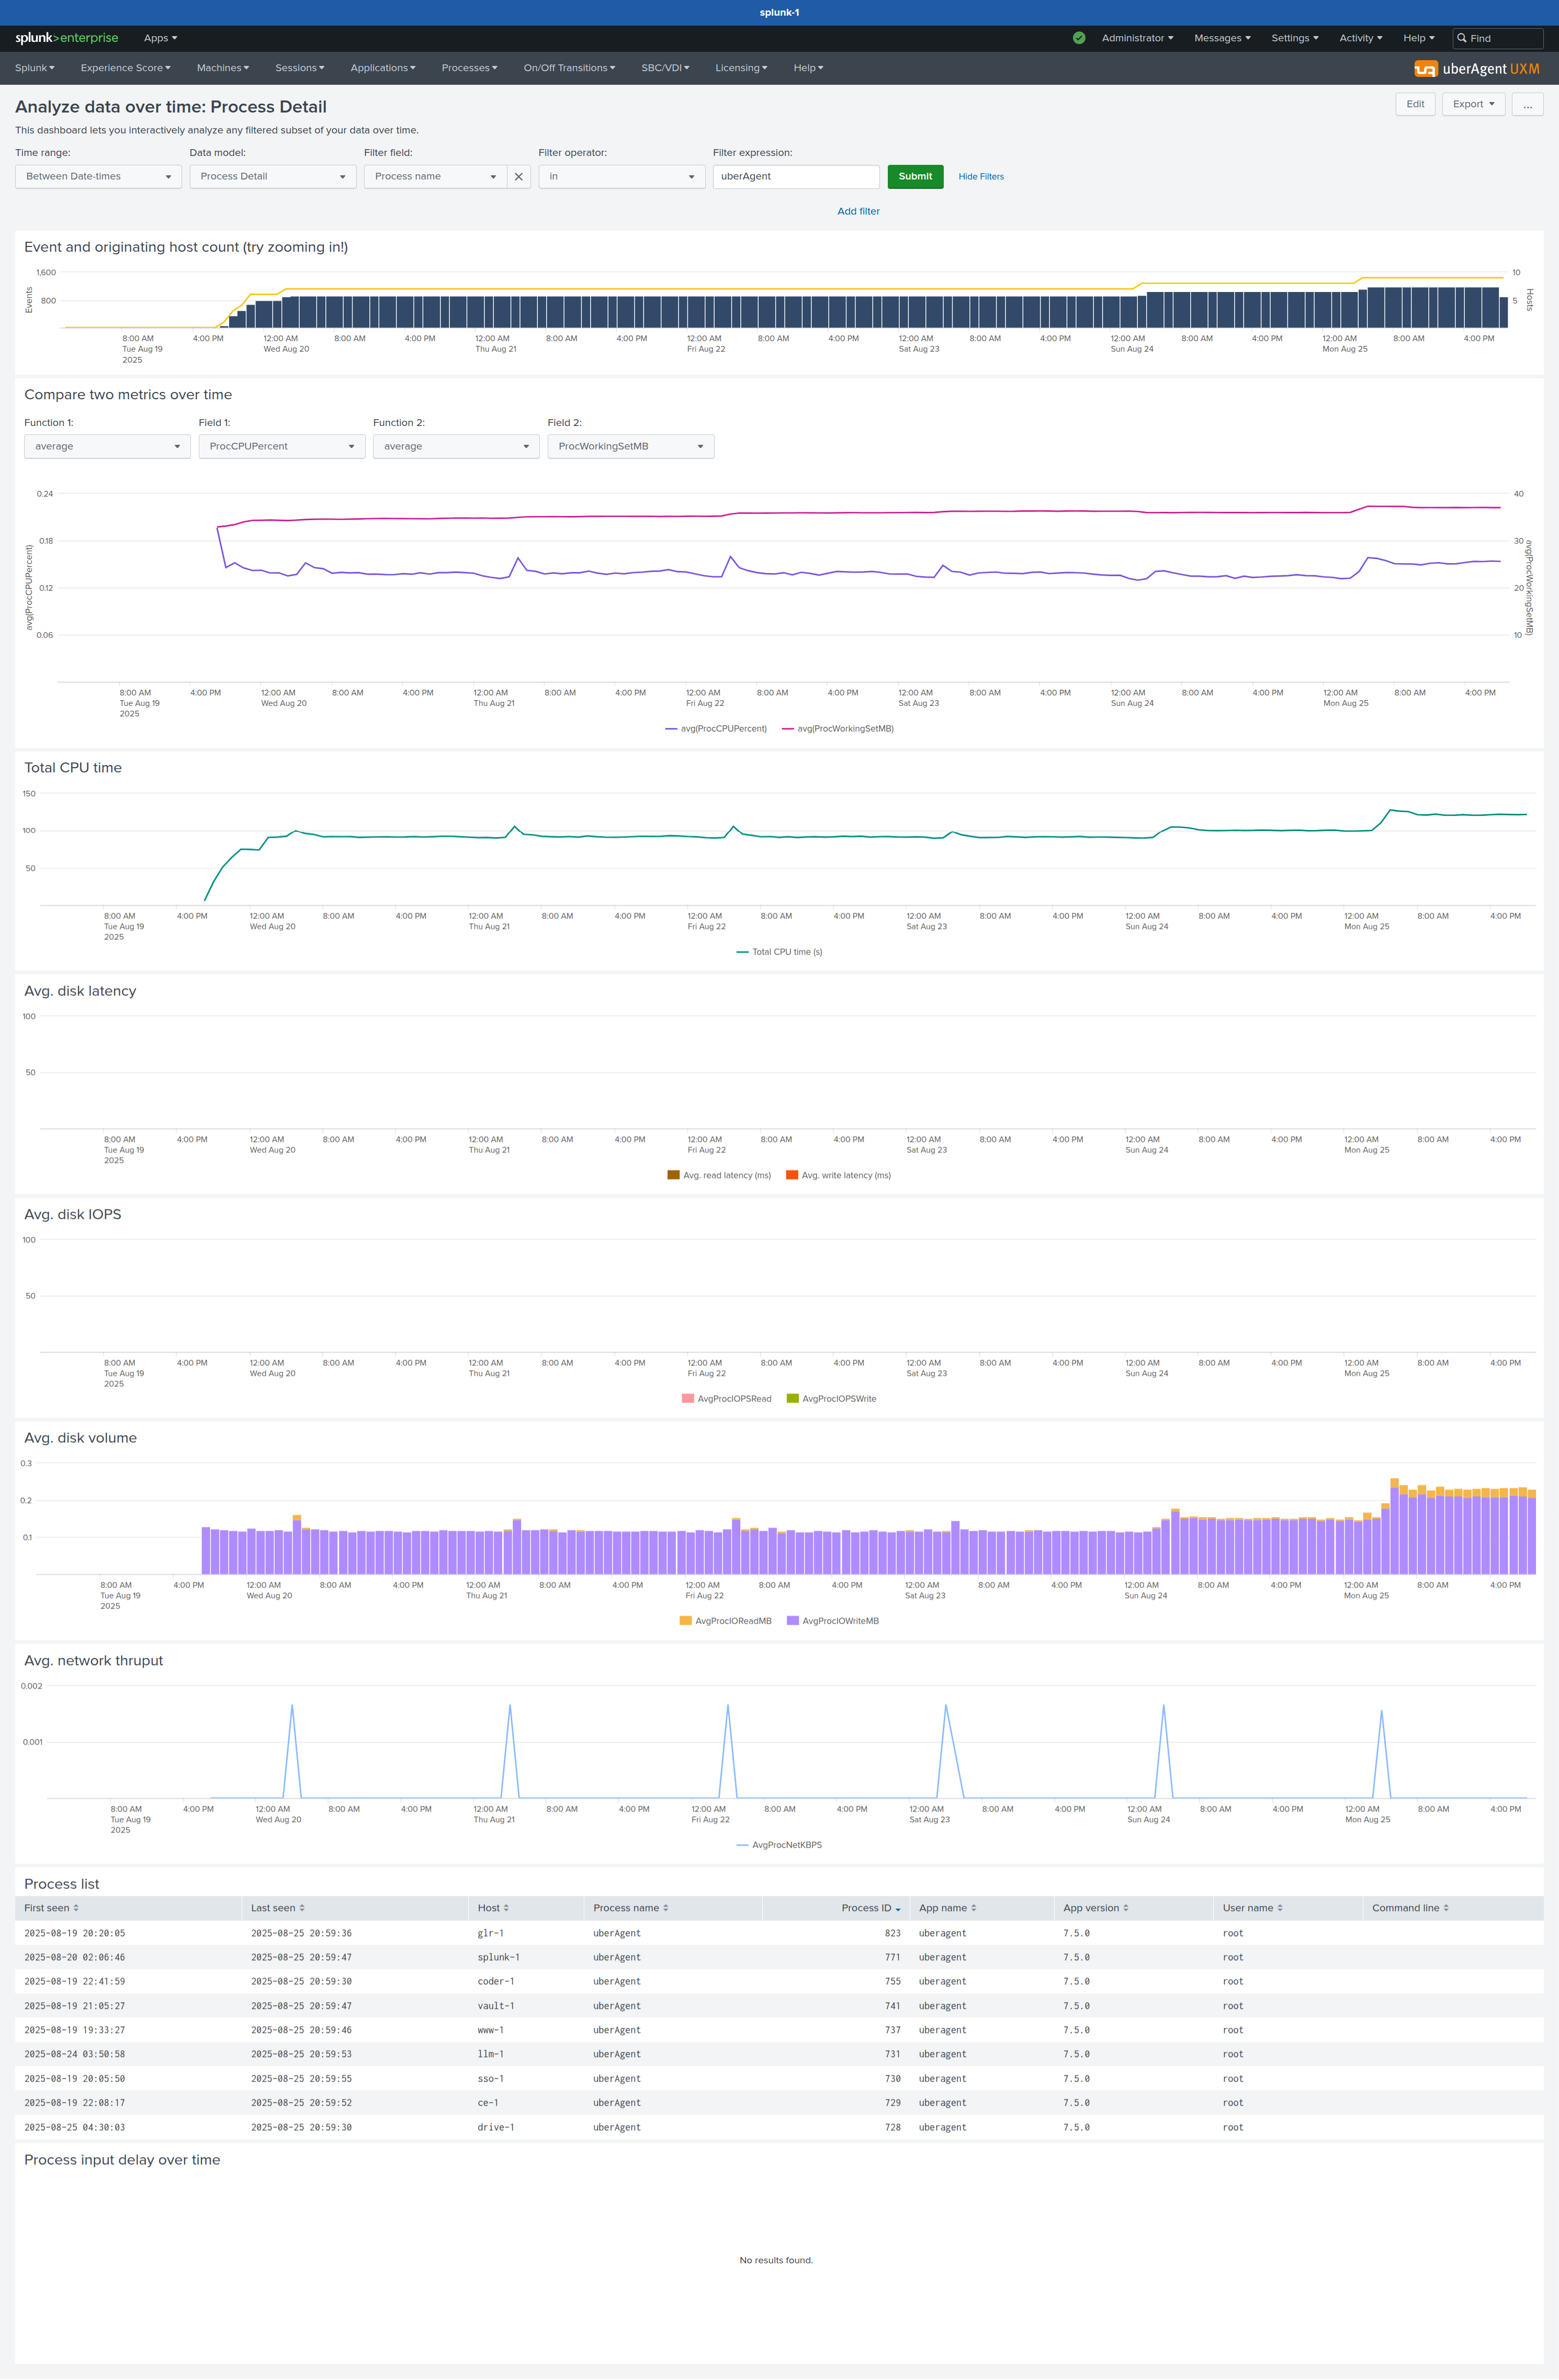
The results are impressive: uberAgent delivers comprehensive monitoring with minimal overhead. You're looking at resource consumption so low that you'll question whether it's actually collecting all that data.
- CPU impact: Consistently under 1% across all monitored systems
- Memory footprint: Typically 20-50MB per agent - less than a single browser tab
This is monitoring software that enhances your visibility without becoming a performance bottleneck.
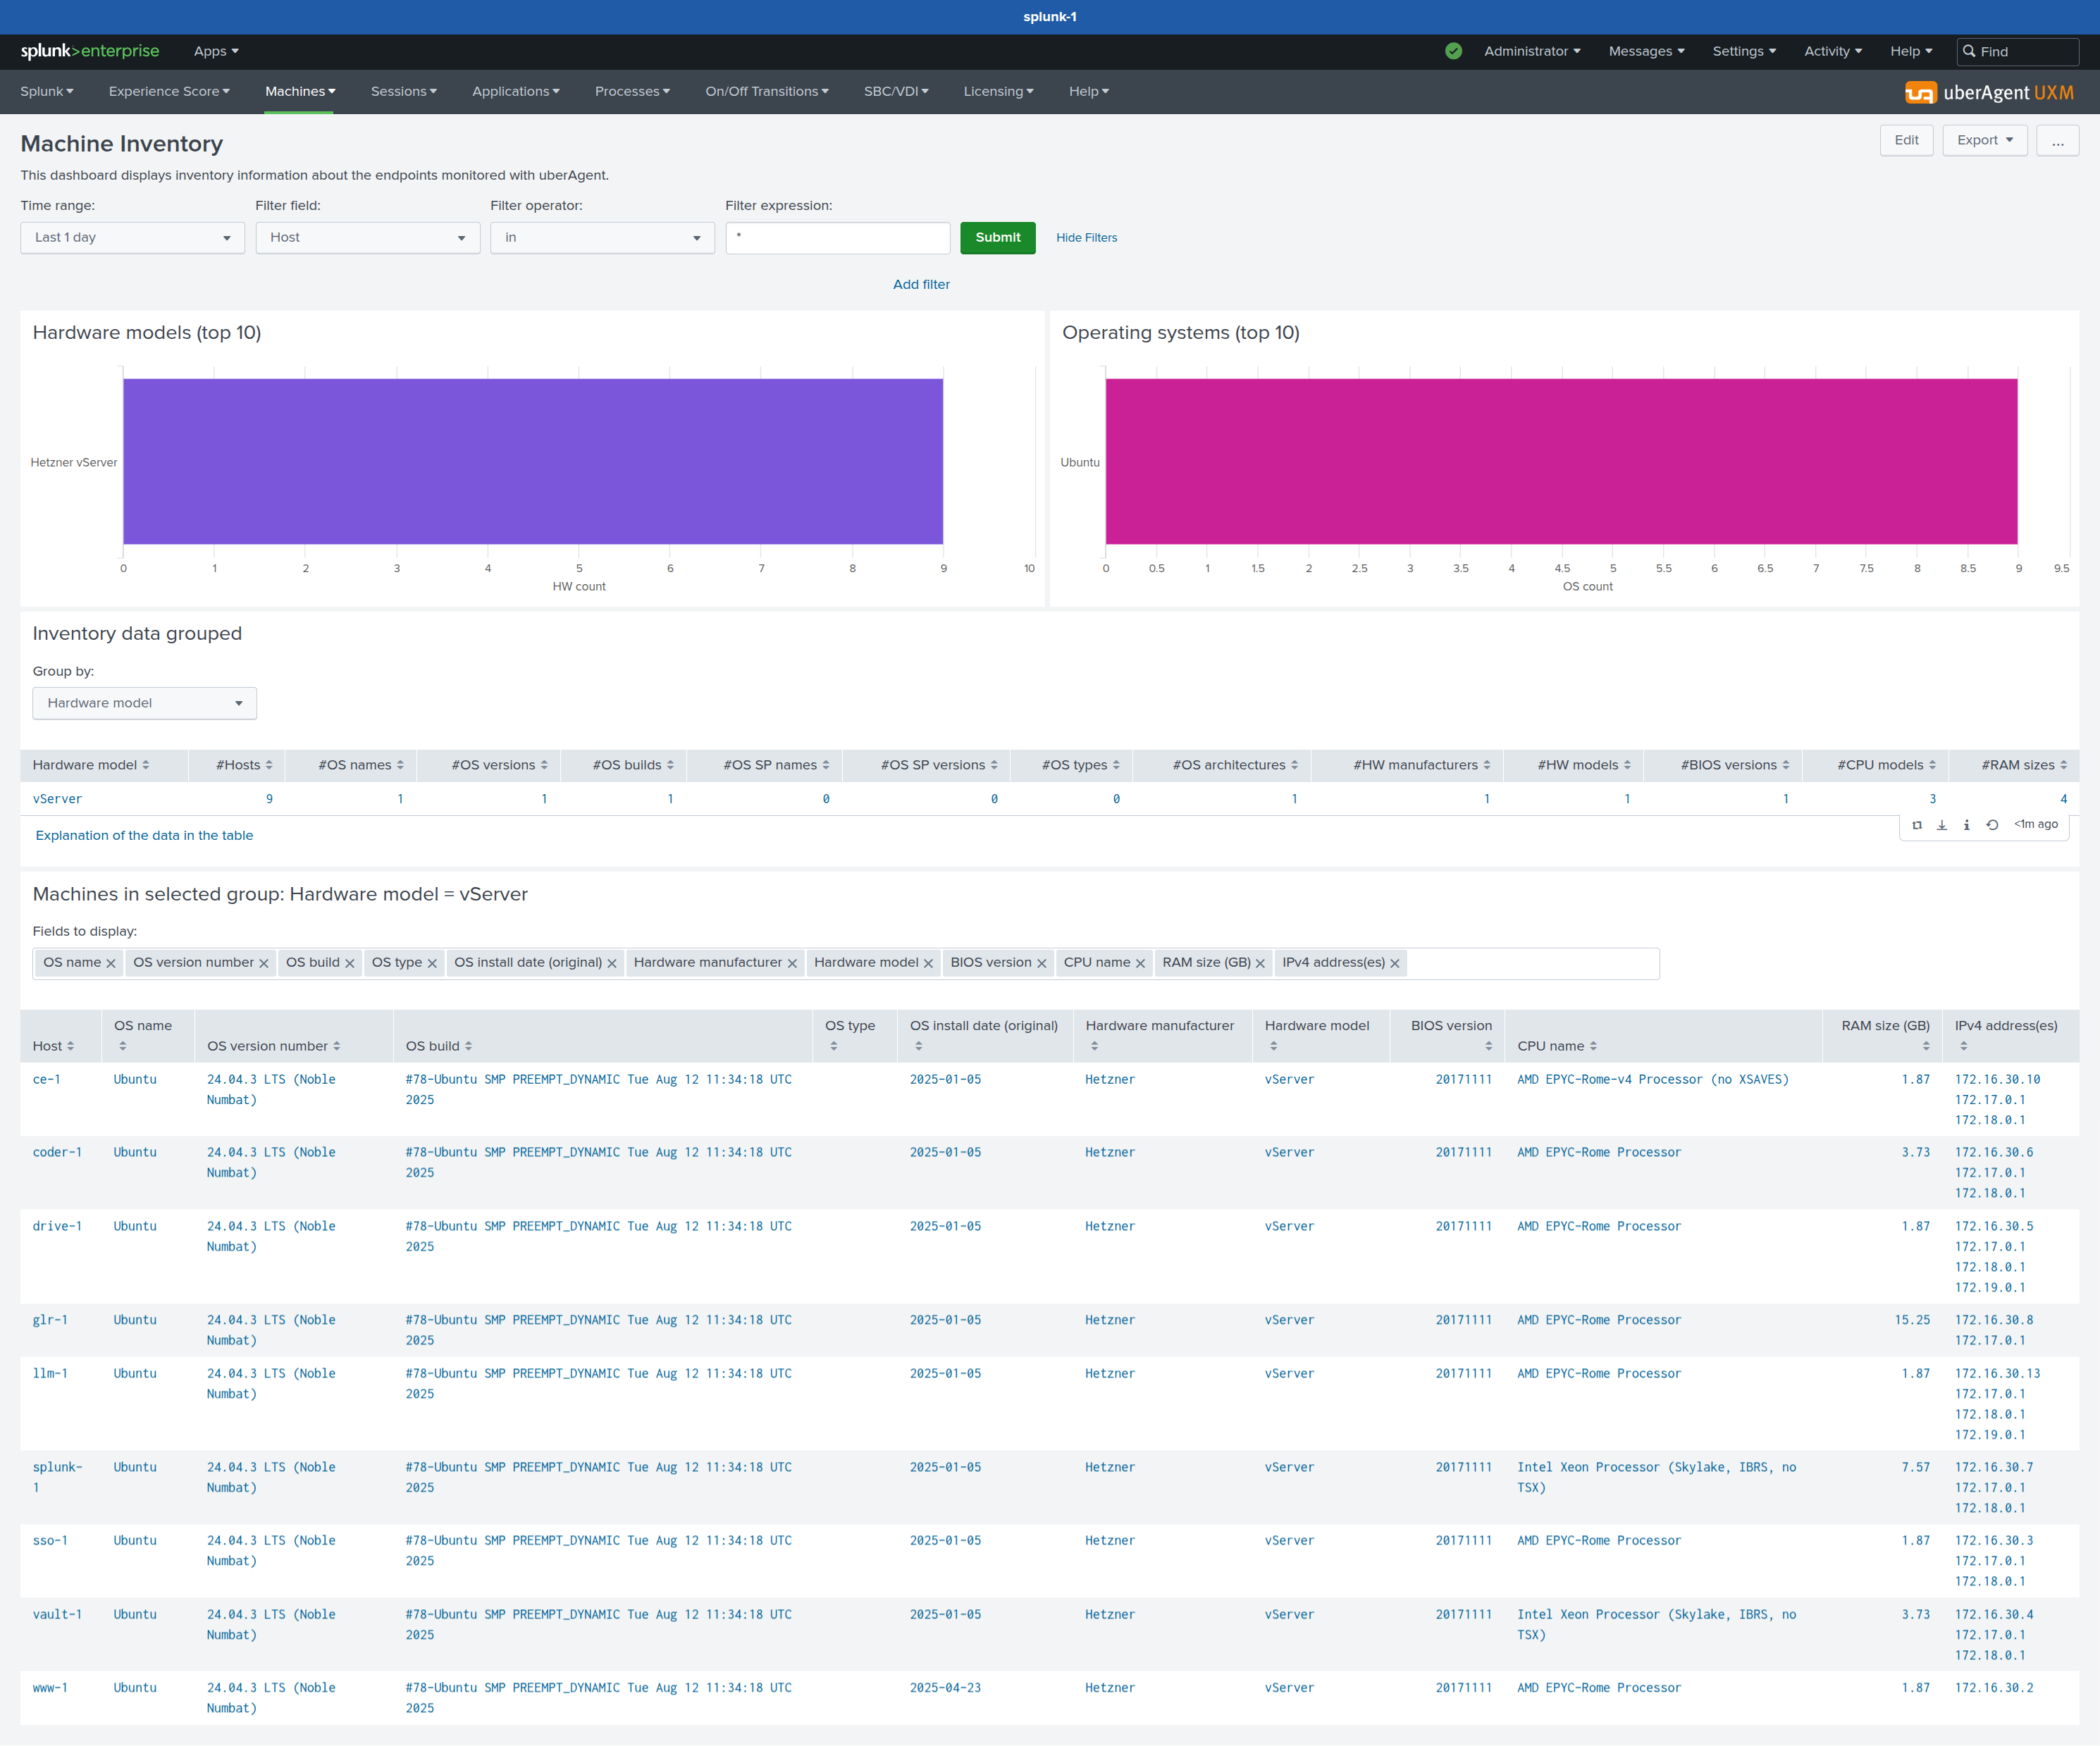
Infrastructure Discovery
Your complete infrastructure topology emerges automatically as agents come online. Having a machine inventory I can rely on, next to my Ansible inventory is great. I really like this one.
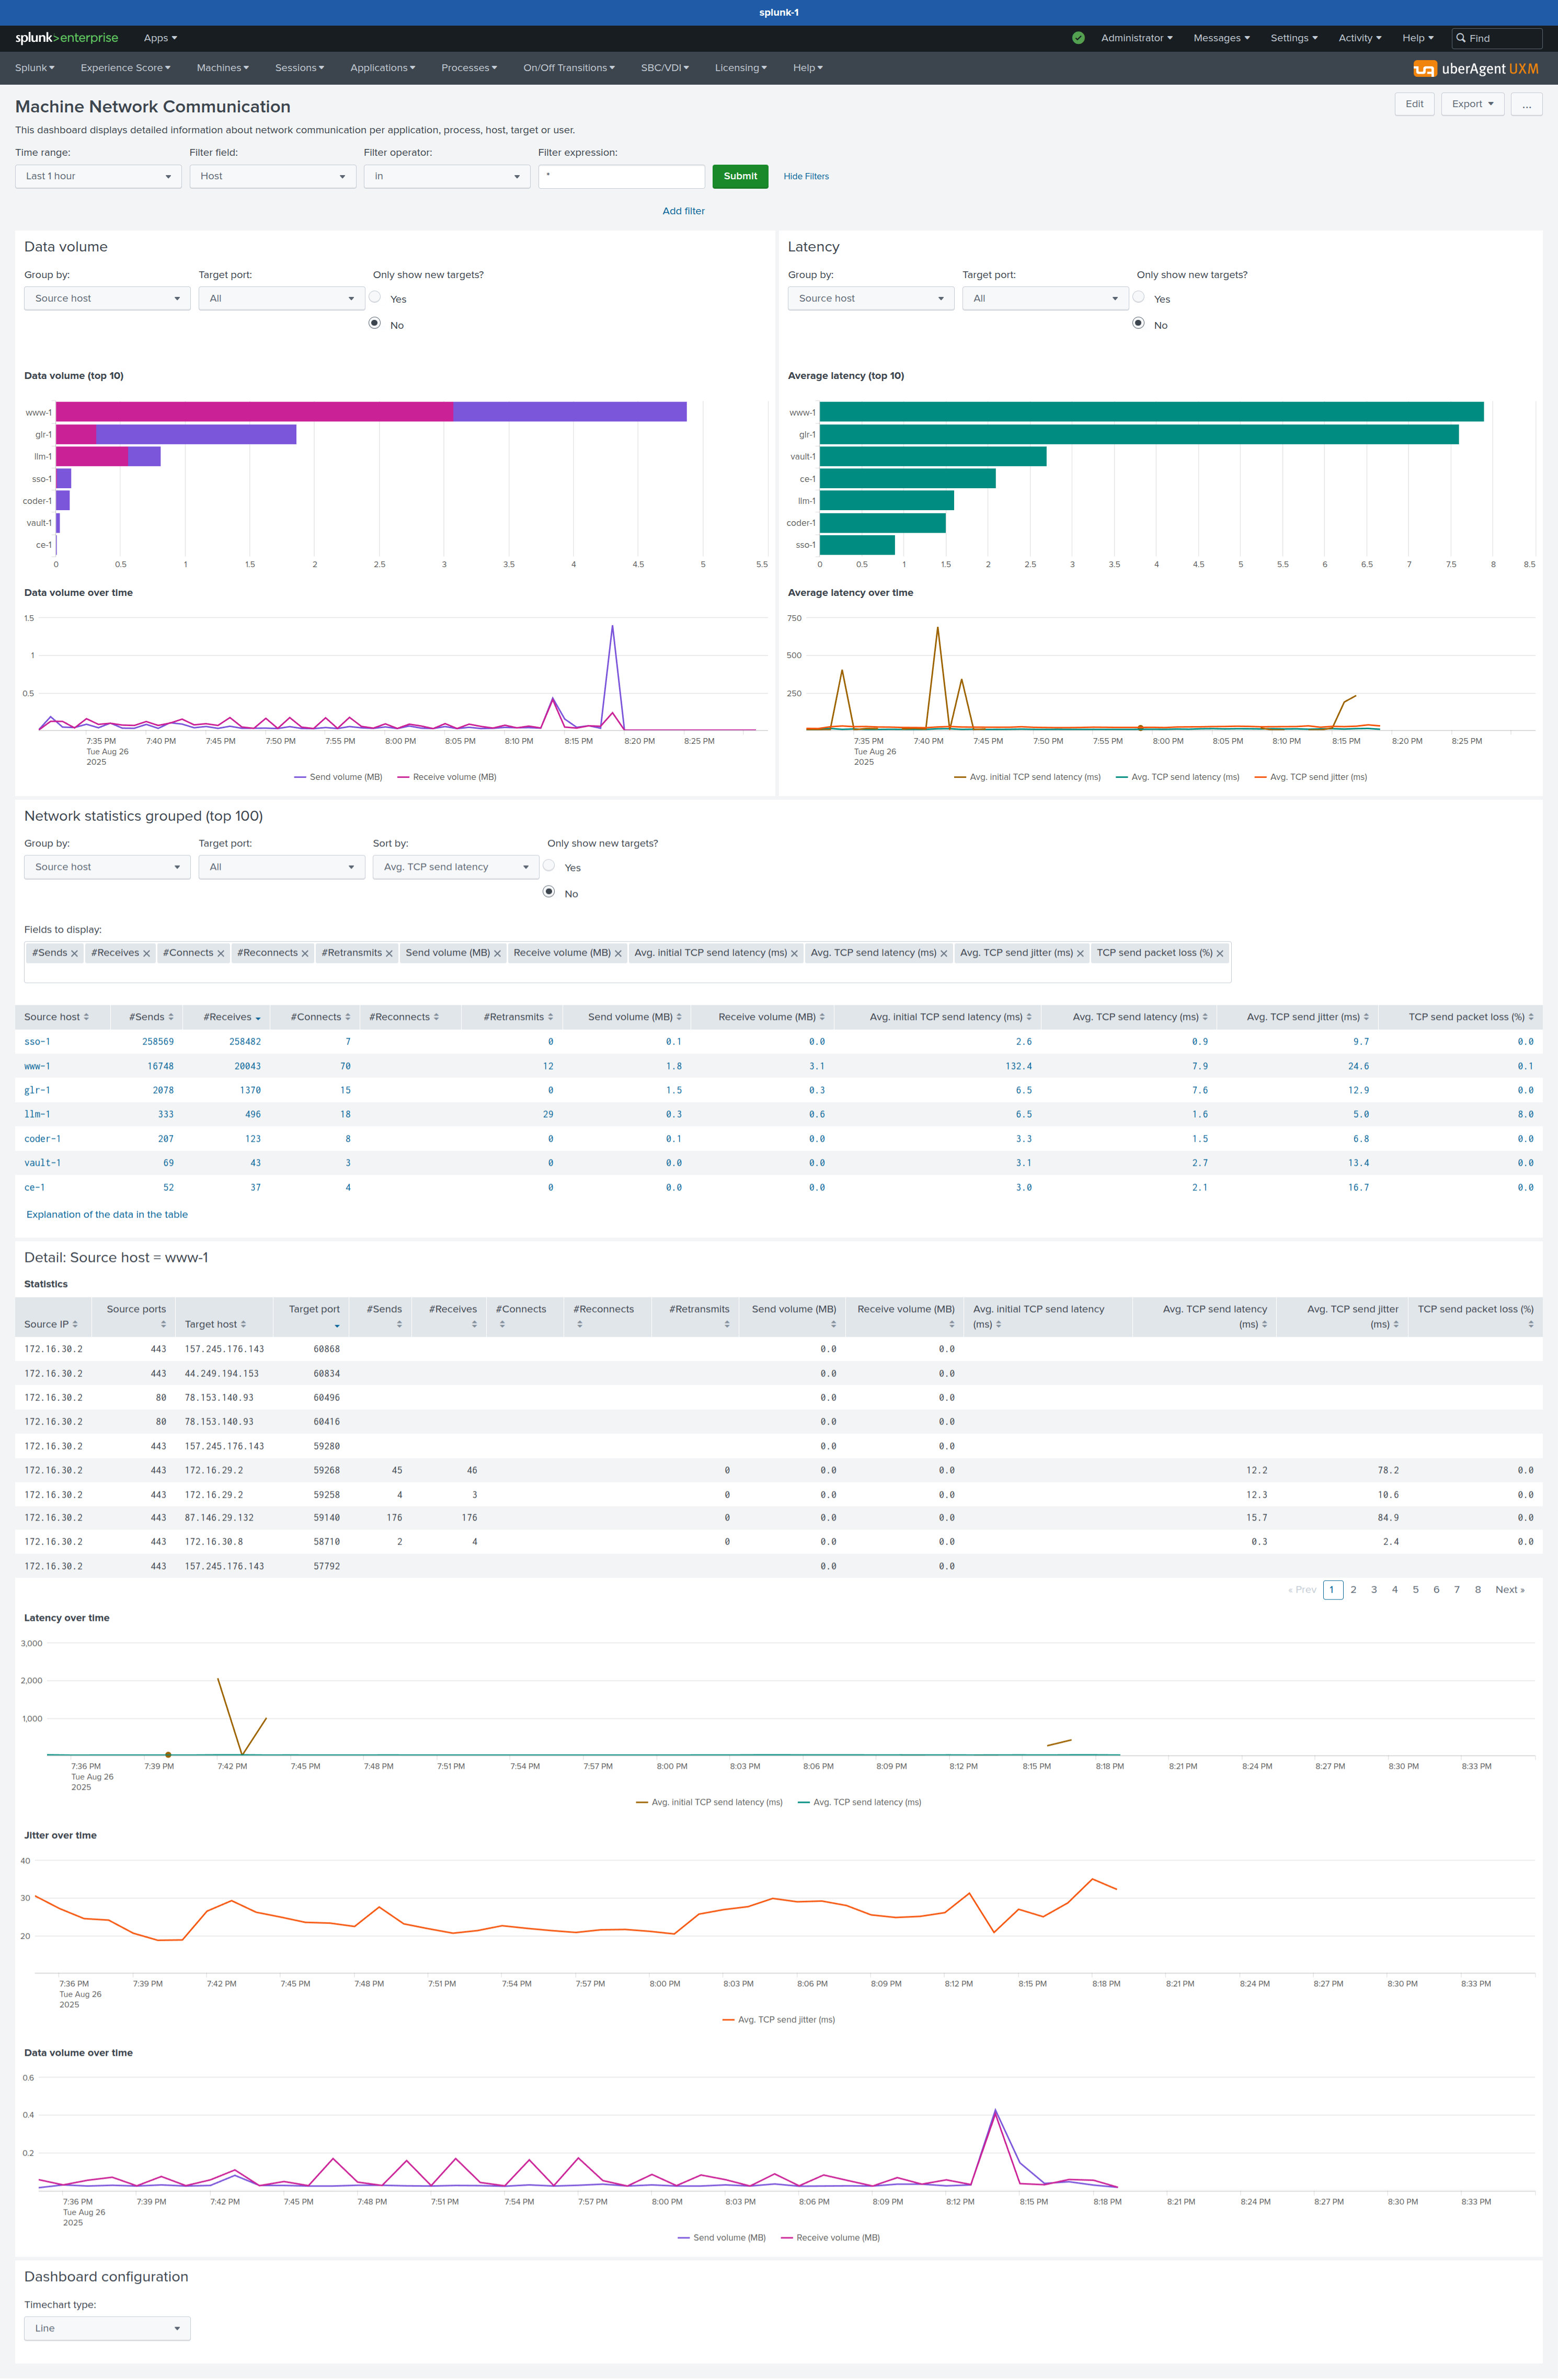
Network Flow Visualization
Understanding inter-service communication becomes trivial when you can see exactly which services talk to each other and how much traffic flows between them.
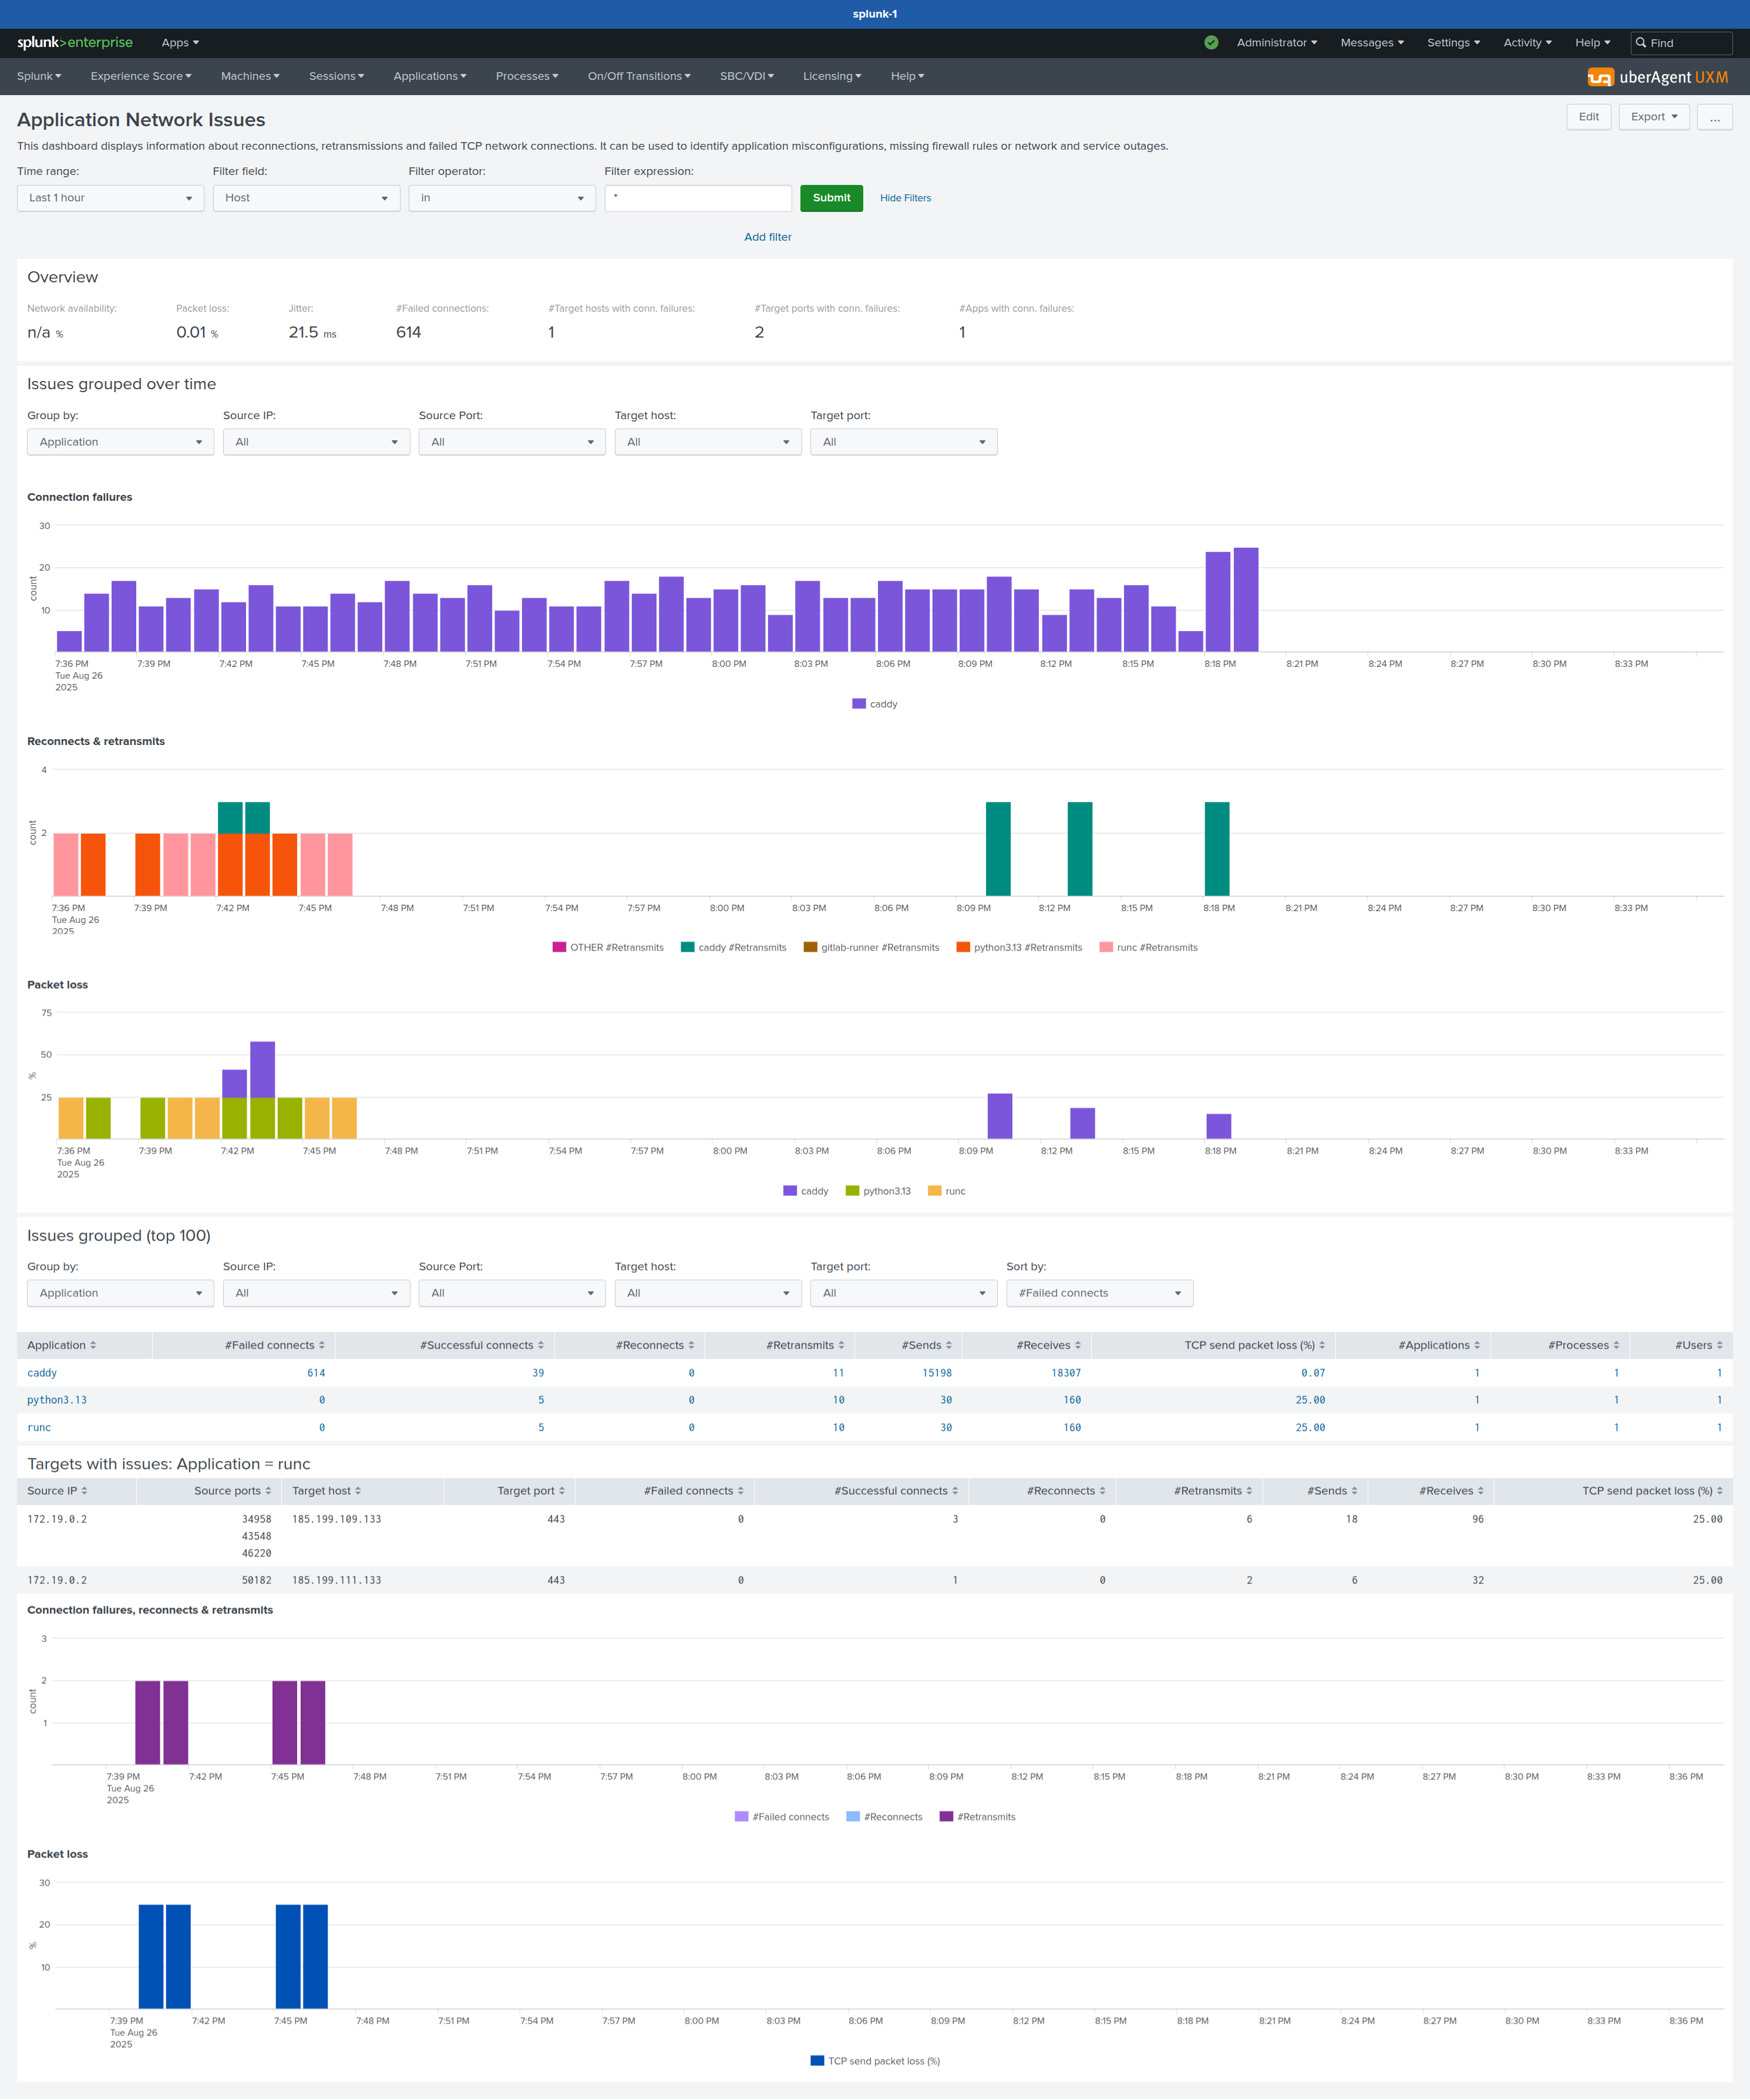
Application-Level Troubleshooting
When applications start misbehaving, you get immediate visibility into network-related issues that traditional monitoring tools miss entirely.
Wrapping Up
This is it - uberAgent for Linux doesn't just add another platform; it completes the entire monitoring ecosystem.
Think about what this means: your existing Windows and macOS monitoring now gets perfectly extended with comprehensive Linux coverage. We're talking about Linux VDAs running in your Citrix environments, non-VDA Linux desktops handling critical workloads, Linux thin clients connecting to your Citrix infrastructure - suddenly every endpoint in your environment speaks the same monitoring language!
But here's what gets me absolutely thrilled: Server workloads!.
Your Docker hosts, Kubernetes clusters, database servers, message queues, reverse proxies, microservices, load balancers - EVERYTHING now gets that same incredible uberAgent visibility that made Windows monitoring so powerful. Whether it's Citrix infrastructure, bare metal servers, or cloud-native workloads - it all fits together in one unified, beautiful monitoring toolbox.
This is infrastructure observability done right: one agent, one data format, one set of dashboards covering your entire technology stack from end-user experience down to kernel-level performance metrics. Citrix environments, non-Citrix infrastructure, hybrid cloud setups, on-premises data centers - it's all there, all visible, all making sense together.
The deployment stays effortless (thanks to Ansible automation), performance impact remains minimal, and the insights now span absolutely everything. No more tool sprawl, no more monitoring blind spots, no more wondering if that user complaint is related to the application, the network, or the underlying infrastructure.
Ready to achieve monitoring enlightenment? Deploy this Technology Preview and watch your entire infrastructure transform from a collection of mysterious black boxes into a completely transparent, interconnected system where every component tells its story.
What's Next?
After deploying uberAgent across my infrastructure, I quickly noticed one challenge: data volume. While the insights are invaluable, my home lab generates monitoring data at a pace that exceeds typical residential environments.
With Splunk's free licensing constraints (500MB/day), I am implementing Event Data Filters as a solution and add a optimized data volume configuration. However, I'm already contemplating the next evolution - developing a custom backend infrastructure with purpose-built visualization dashboards specifically optimized for my environment.
This technical challenge would be particularly engaging - balancing comprehensive visibility with resource efficiency. For now, though, the filters keep things manageable while I plan the next iteration of my monitoring architecture.
Disclosure Note: I am a Citrix employee. However, this post represents my personal enthusiasm and experience with the product, not an official company perspective. I wrote this entirely of my own volition because I'm genuinely excited about these capabilities.